


When you ask most CFOs of hospitals about the status of their revenue cycle process, you are likely to get either of two responses. One would be something along the lines of “it’s fine, we keep collecting our payments”, and another – “to be honest, I’m not really sure”. Neither option is a good answer.
The entire revenue cycle process affects every single dollar made by your healthcare facility. From scheduling to eligibility determination to processing and posting payments – each step of the way opens up an opportunity for some of the money to escape. A forgotten authorization. Miscalculated billing. Nine-day delays in processing claims. Unresolved denials due to too many claims to process.
It’s hard to resolve a problem without being aware of it first. That is why it is so crucial to have good revenue cycle management metrics in place.
This guide provides an overview of the eight KPIs in the healthcare revenue cycle that the CFO and other finance leaders must track. In addition to getting the definition and calculation of each of the eight KPIs, you will learn what the benchmarks are and what actions to take when the figure falls off the radar. We will show you how to create a useful KPI dashboard for the revenue cycle.
Why Revenue Cycle Management Metrics Matter More Than Ever
Tighter margins prevail throughout the healthcare sector than at any point in recent years. Increased costs for labor, increased complexity of payer policies and higher denial rates characterize the industry now.
Revenue cycle monitoring has never been more important to help practices and hospitals stretch their revenues. Consider what benefits it brings:
- Problems are caught early. An increase in denial rate in week two can be corrected quickly. The same problem detected at quarter end means money is lost.
- Monitoring establishes the link between your operations and your profit and loss. Once you can confidently say “A two-point decrease in our clean claims rate means we are losing approximately this much every month,” all discussions about your billing processes with the billing team and the board become much more productive.
- The return on investment is quantified. If you decide to make an investment in new software, training or an outsourcing partner, metrics will tell if the investment was effective.
- Monitoring keeps the accountability process objective. Numbers remove the uncertainty and the finger pointing out of performance reviews of your billing team, regardless of whether it is outsourced or in-house.
The most successful financial managers do not measure everything. Rather, they measure what is important, doing so repeatedly against significant criteria. Let’s take a closer look at them.

Metric 1: Days in Accounts Receivable (Days in A/R)
What it measures: The number of days that it takes to receive payment after the delivery of a service. It is one of the most frequently observed KPIs in the field of RCM since it shows the speed of cash flow.
How to calculate it: Take your outstanding A/R and divide it by your average daily net revenue. For instance, if your A/R is $2.4M and your average daily net revenue is $60,000, your Days in A/R would be 40.
Benchmark: As seen in many industry publications and such as those published by HFMA MAP Keys, about 30 to 40 days is considered acceptable for almost all types of providers. The specialties with high payer-mix complexity and high amounts of patient responsibility are more likely to have above numbers. Anything over 50 days needs investigation.
What it says: Increasing Days in A/R indicates three possible issues – slow claims submission, payer delay, and denial management issues. As you can see, it is a lagging indicator which means that once you see the problem there has been something wrong for quite some time already.
What to do about it:
- Segment A/R by payers. One slow-paying payer could skew your overall average.
- Look at charge lag (Metric 7) to determine whether your claims are going out the door late.
- Have a strong follow-up process in place for claims that get no response within 30 days.
- See whether your denied claims are being followed up on in days and not weeks.
An average is just that – it’s an average. A practice that has an average of 38 days for all claims could have 28 days for Medicare and 71 days for a commercial payer.
Metric 2: Clean Claim Rate and First-Pass Resolution Rate
What is measured? Percentage of claims accepted by the payer on initial submission without requiring any changes or resubmission. Related, but not exactly the same, metric is First Pass Resolution Rate (FPRR), which is the percentage of claims paid on initial submission. Clean claims rate lets you know if the claim was accepted, while FPRR lets you know if it was actually paid.
How to calculate? Total clean claims submitted divided by total claims submitted, multiplied by 100. In case of FPRR, use claims paid on first submission as the numerator.
Benchmark? Organizations that follow best practices are trying to achieve a clean claims rate of at least 95%. FPRR should be 90% or higher. A clean claims rate in the low 80s means that your organization spends a lot of employee’s effort in order to fix things.
Why should CFOs care? All the denied claims require financial resources in order to be fixed. It is commonly known that industry average cost of reworking a denied claim ranges from $25 up to $118 per claim.
What to do about it:
- Use a claim scrubber to test for payer specific edits prior to submission.
- Validate insurance and demographic information during scheduling and check-in.
- Identify the primary reason for claims rejection at the clearinghouse and address the problem.
- Provide feedback to front office staff members. Most problems are due to lack of training.

Metric 3: Denial Rate
What it measures: The percent of submitted claims that are denied. Clean claims rate may be the “front door” metric but denial rate is what gives you the bottom line on the amount of revenue in question.
How to calculate it: Total denied claims divided by total submitted claims times 100. The metric can also be calculated on dollars (denied dollars divided by total dollars billed), which tends to yield more useful information.
Benchmark: Average industry denial rates reportedly vary between 10% to 12% or more recently, while best-in-class companies strive to keep initial denial rates under 5%. If your initial denials run in double digits, there is something seriously wrong that should be identified.
Why it is important for ROI: There are three costly factors related to denials. First, there is the cost of delayed reimbursement. Second, there is the expense of working a denial. Third, there are denials that will never be reworked because the window passed or simply because there was no time to get to them. It turns out that denied claims never reworked constitute a considerable percentage according to industry research.
Get even more granular: One denial rate won’t do you any good. Here are some categories:
- By reason for denial: Eligibility, authorization, medical necessity, coding, timely filing, duplicate claim.
- By payer: Certain payers may have many more denials than others; patterns usually mean a problem in your contract or process.
- By provider or department: A pattern specific to certain clinicians probably means you need to address documentation or coding.
- Preventability: By distinguishing between “avoidable” and “unavoidable” denials, you will know what to focus on.
Actions to take: Create a denial management process that includes root cause analysis once per month. The idea is to make sure you’re not just fixing the same issues repeatedly. If authorization denials are the most common, you’re addressing the issue in your front-end, not your appeals process. This is exactly the sort of thing a well-run medical billing KPI system uncovers.
Metric 4: Net Collection Rate
What it measures: After subtracting all the contractual adjustments you were entitled to apply, how much of your contracted amount did you collect? This is probably the single best measure of your billing process efficiency.
How to calculate it: Payments / (charges – contractual adjustments) x 100. Please note that this measure is different from the gross collection rate, which shows the ratio of payments to total billed charges and may appear unreasonably low because of that.
Benchmark: The good net collection rate is 95% and higher; best in class is even higher, close to 100%. You are losing money when your net collection rate is at the level of 88%-90%.
Why CFOs need to pay attention: This is where revenue cycle management meets the bottom line. An improvement of 1 percentage point in net collection rate on a large revenue base gives you additional money almost for free. You have provided the services already. You have done the work.
What to do about it:
- Compare net collection rate versus contracted rate to find out about underpaid claims.
- Check write-offs. It’s important that they are supported and approved and not simply used as a trick to make the list empty.
- Check payer agreements and conduct periodic underpayment audits.
- Ensure that filing deadlines are tracked so you won’t miss valid claims.
Underpayments – this is the real villain here. Payers pay the claim, it posts, but nobody looks whether the amount paid is correct according to the agreement. In a year, it all sums up.
Metric 5: A/R Aged Over 90 Days
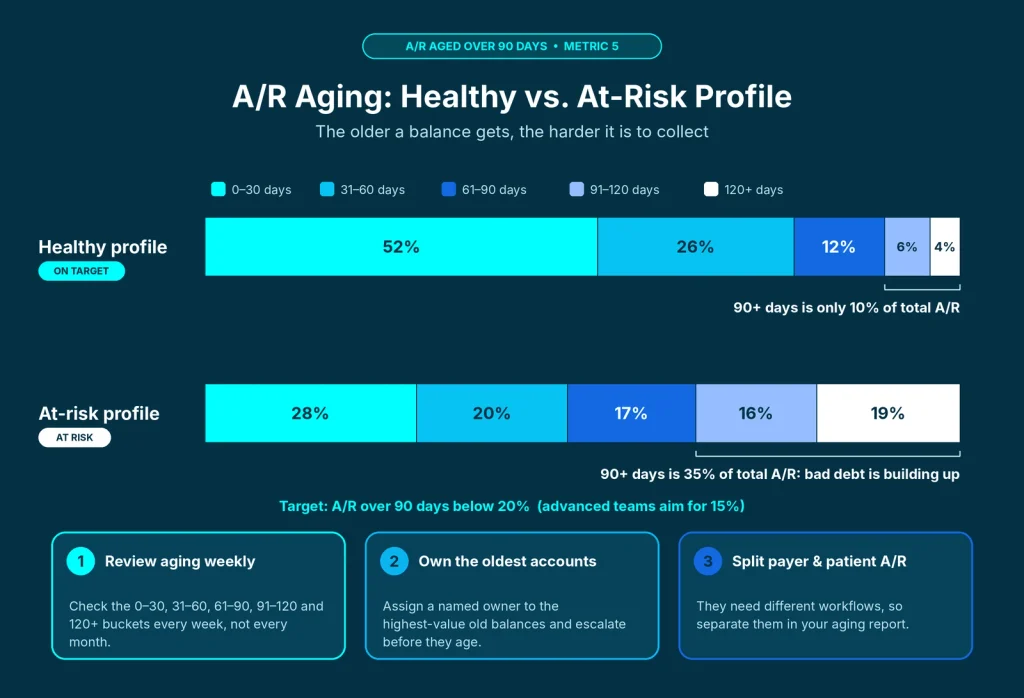
What it measures: The proportion of your overdue receivables aged over 90 days. Whereas Days in A/R will show the average age, this ratio will highlight the long-tail of the aging accounts receivable report, which becomes increasingly difficult to collect from each passing week.
How to calculate it: Overdue A/R over 90 days ÷ total A/R × 100.
Benchmark: Most companies strive to maintain the ratio under 20%, with more advanced companies seeking even better results at 15%. The longer the receivable is overdue, the smaller the chance that it will be recovered. The recovery chance is especially low after 90 and 120 days.
Why it matters: Even with favorable average ratios, a growing pile of old balances may turn out to become bad debt.
What to do about it:
- Check aging buckets on a weekly basis (0 to 30, 31 to 60, 61 to 90, 91 to 120, 120+).
- Take ownership of the oldest and highest value accounts.
- Separate payer account balances from patient account balances, as they require different processes.
- Escalate high-value accounts instead of waiting until they become aged.
Anyone who has taken over a legacy A/R book from a previous provider will be aware that there is no end to old and forgotten balance that could be found within aging buckets. It is one of the quickest wins that could be achieved in the first 90 days of the process improvement project.
Metric 6: Cost to Collect
What it measures: The amount of money you spend in order to bring in one dollar of revenue. It includes staff salaries, software, clearinghouse expenses, costs related to outsourcing, and overhead expenses associated with the revenue cycle.
How to calculate it: Total revenue cycle operating expenses divided by total cash received multiplied by 100.
Benchmark: Research by the Healthcare Financial Management Association (HFMA) often mentioned a typical percentage of net patient revenue to operate the revenue cycle in the range of 2 to 4%. If your expense is significantly higher than that, it could be either because of inefficiency or due to your organization’s volume being too small.
Why it is important for ROI: This is a metric that turns the “should we outsource?” discussion into a real calculation. The example is quite simple – if your in-house team spends 6% of collections to bring money in, but an external specialized company will do that at a lower percentage while increasing the collection rate, then the calculation is obvious. However, there are other considerations besides lower cost to collect. You should never improve your cost to collect if your collections become worse in the process.
What to do about it:
- Draw up the current uses of staff time. It’s often rework and follow-up.
- Automate the repetitive processes, e.g., for eligibility determination, claims status, and payments posting.
- Do an honest comparison of in-house versus managed service costs, with all costs taken into account, including those for turnover, training, and licensing.
- Don’t look at the numbers in isolation. Increasing cost to collect, constant revenues is a warning sign.
Metric 7: Charge Lag and Days to Bill
What it measures: The length of time from the date of the service until the date when the claim was created, and subsequently the date of claim submission. Also known as “discharged not final billed” (DNFB) when using hospital terminology.
How to measure it: Find the average days between date of service and claim submission. In the hospital environment, measure DNFB by tracking dollar amounts for discharged accounts not billed.
Benchmark: Most practices have their goal set at submission of claims on the same day, or one to three days after the service.
Why it’s important: This is the first possible delay in your revenue cycle. Every day that your claim remains un-billed is another day you’re pushing back your money. Slow charge lag will quietly increase your Days in A/R and in some instances result in timely filing denials that cannot be recovered.
Common causes of delay:
- Inaccurate/late clinical documentation
- Pileup of coding work and understaffing
- Slow provider in signing off documents
- Authorization/referral document missing
- Manual/pen and paper charge capture
How to fix it: Establish clear turnaround time expectations from providers/coders and follow up with weekly reporting. Most organizations realize that only a few providers are responsible for creating those bottlenecks. A discussion backed with numbers usually works.
Metric 8: Patient Collection Rate and Point-of-Service Collections
What it measures: The efficiency of your collection efforts regarding patient responsibility payments—co-payments, deductibles, and coinsurances. With the prevalence of high-deductible health plans, patient responsibility is a major source of revenue for many organizations, but it’s among the most difficult to collect.
How to measure it: Patient responsibility payments collected divided by total patient responsibility, times 100. To measure front-line collection, compare what you have collected before or on the day of the encounter versus what could have been collected.
Benchmark: Most organizations strive to collect 50 percent or more of their patient responsibility at the point of service, with the overall patient collection percentage being as high as possible. Once a patient walks out of the facility without payment, collection becomes more difficult and expensive.
Why it’s important: Collection of patient responsibility costs money; statements, reminders, and even payment plans cost money, and the longer the bill ages, the less likely it will be collected. Good front-end collections not only preserve revenue but also help maintain a good patient relationship, as unexpected bills rank as a top factor of patient dissatisfaction.
What to do about it:
- Patients should be informed of the cost beforehand.
- Several options must be available for payment: online, text to pay, and payment plans.
- The front desk personnel should know how to discuss payments in an assertive yet pleasant way.
- It is important to confirm the benefits so that the payment estimate is accurate.
In this case, transparency plays a key role. Patients will be ready to pay when they know what for.
Other Revenue Cycle Metrics Worth Tracking
These are the eight key ones. Depending on your company, these supporting measures can provide important additional information:
- Bad debt rate: This is the proportion of bad debts in the total revenue collected. Keep it separate from charity care.
- Appeal reversal rate: This is the percentage of appeals made that succeed. If this percentage is very low, there might be some weaknesses in the documentation process.
- Authorization denial rate: Very relevant for specialties that require prior authorization.
- Payment posting timeliness: The period between receiving payment and posting it. Delay in posting payments can skew your measurements.
- Adjustment/write-off rate: Good for detecting unauthorized write-offs.
- Registration error rate: Leading indicator for many denied claims.
- Coding accuracy rate: Measured using internal audits to verify coding documentation.
These are not all necessary for every organization in their primary dashboard; pick those few which apply to your major risks.
Revenue Cycle Benchmarks: A Quick Reference
Below is a guide to help distinguish targets from one another using industry standard ranges. Please consider the following numbers as benchmarks, and adapt them as necessary according to your speciality and practice size.
- A/R days: about 30 to 40 days
- Clean claims: at least 95%
- First pass rate: 90% or higher
- Denial rate: below 5%
- Net collections: 95% or higher
- Overdue A/R (90+): below 20%, preferable below 15%
- Cost to collect: about 2 to 4% of net revenue per patient
- Charge lag: 1 to 3 days
- Collections at POS: 50% or higher
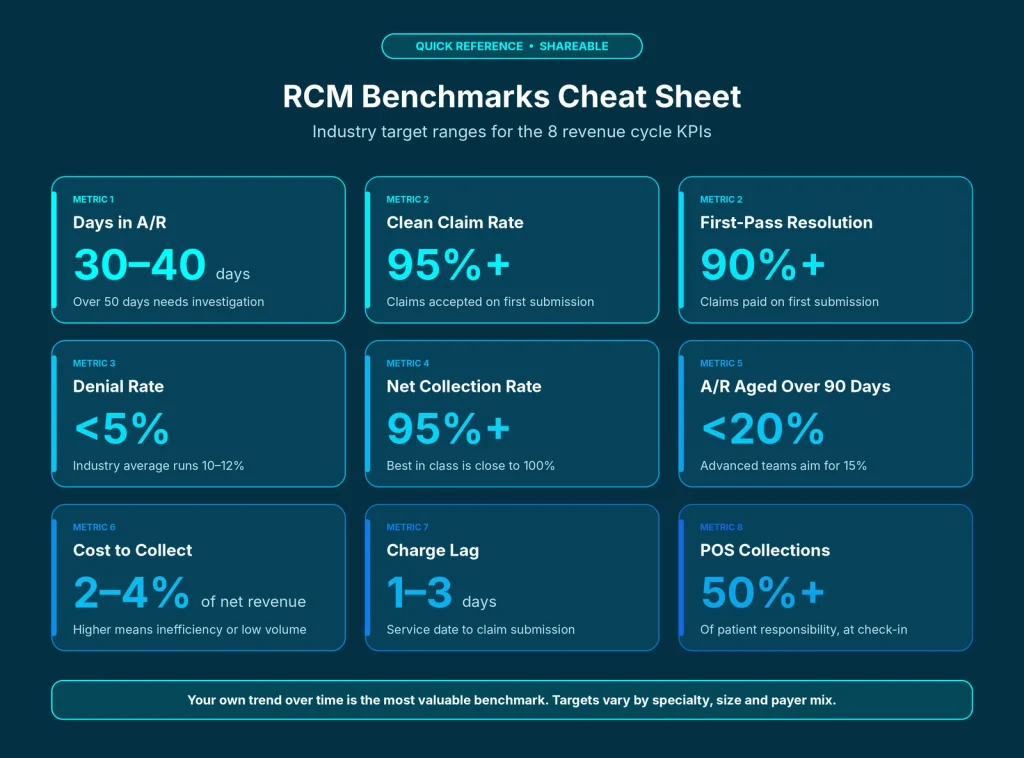
Revenue cycle benchmarking caveats: there is no one-size-fits-all benchmark that will apply to any medical institution regardless of what it treats and when it operates. Behavioral health practice, orthopedics group and a rural hospital have different realistic benchmarks. The most valuable benchmark would be yours, the one that reflects your progress through time. Start by measuring your current position, setting a realistic improvement goal and tracking progress month by month.
How to Build a Revenue Cycle KPI Dashboard That People Actually Use
A revenue cycle management dashboard is nothing if no one opens it. There are simply too many dashboards which serve as wallpaper—overcrowded, slow and unclear. Here is how to create a meaningful dashboard.
- Create it around the decisions to be made, not the data. Ask what decisions the dashboard will help to make. Should we augment staffing in denials follow-up? Is some payer underperforming? How close are we to quarterly targets? Work backwards from there.
- Limit yourself to 8 to 10 KPIs in the main view. The eight KPIs mentioned in this article provide an excellent start. Add others to drill-down reports.
- Provide trending information, not snapshots. Data points without historical perspective are useless. Show a year-to-date trend with the target line so that the trend would be obvious immediately.
- Do segmentations properly. Allow for segmentation by payer, location, provider, service line and denial reason. The answer usually lies in the segment.
- Distinguish between leading and lagging metrics. Clean claims ratio, charge lag and registration accuracy are leading. They indicate future outcomes. Days outstanding in accounts receivable, net collections rate and A/R age are lagging. They verify outcomes. Both are required.
- Assign ownership. Each KPI needs an owner. A KPI that belongs to everybody belongs to nobody.
- Review periodically. Operational KPIs every week, financial reporting summaries every month, strategic KPIs every quarter. Make it part of your regular leadership meetings.
- Develop a brief RCM leadership report. A succinct monthly revenue cycle management report that outlines achievements, risks and the next action steps is much more important than a 40-page summary of numbers. Leaders need to know the story behind numbers.
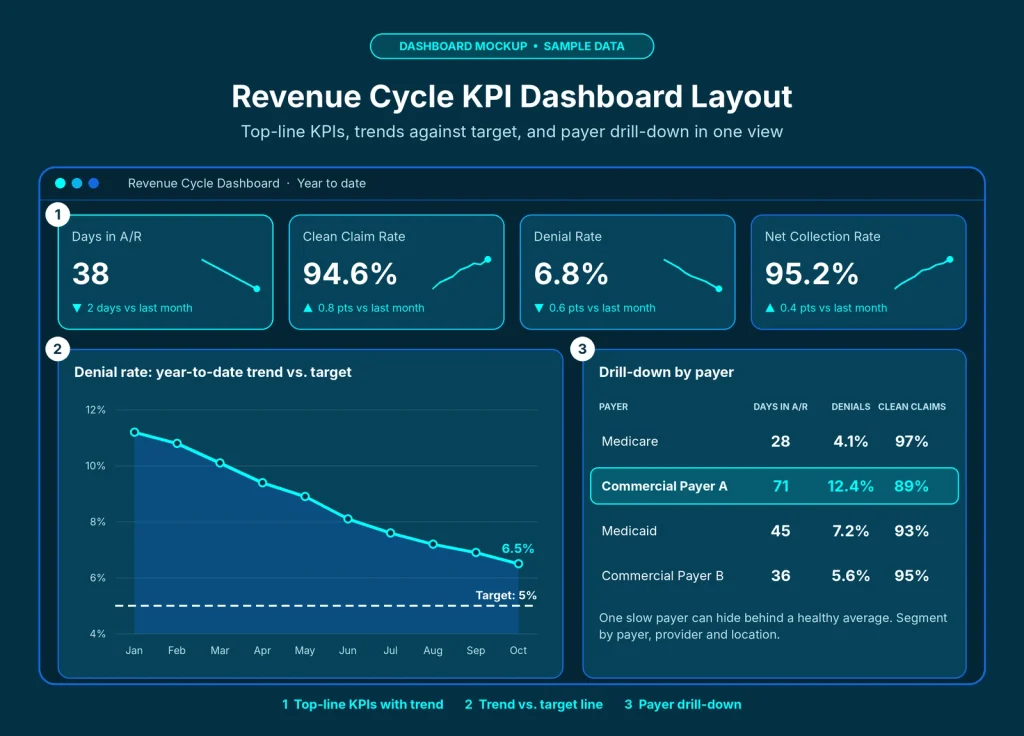
In choosing software that evaluates revenue cycle management, one should consider such features as real-time data, reporting based on payer level, alerting, and ability to connect with EHR/PM systems. A fancy dashboard with outdated data is better off not having any dashboard at all.
Turning Metrics Into ROI: A Practical Framework
Metrics tracking is the first thing to do. But it only becomes valuable when tied to financial gains. Here’s a simple way to achieve that.
Step 1: Baseline. Collect your historical data for each KPI for the last 6-12 months. No skipping this one. How else are you going to show improvement?
Step 2: Quantify the difference. For each metric, calculate what would be the financial gain of closing the gap to your goal. Say, your net collections rate is 92% and your target is 96%. What does 4 percentage points mean in terms of annual revenue? What about the denial rate of 11% to 6% – how much money you will free up and what labor costs you save?
Step 3: Prioritize. Put improvements in order by effect and effort required. Some tools will allow for quick wins, others will require time to implement.
Step 4: Assign action steps and owners. What will be improved, who will take responsibility for it and when you will re-evaluate.
Step 5: Measure and report. Keep tabs on the numbers each month, measure the difference from the baseline and provide a dollar value, not just the percentage of improvement. “We lowered our denials rate by 3 points” is okay. “We saved an estimated extra dollar amount this quarter” is how you get your budget increased.
Step 6: Repeat. The revenue cycle doesn’t have an end point. Payers’ regulations shift, employees quit and new service lines emerge. This is why constant monitoring helps to maintain results.
Common Mistakes CFOs Make With RCM Metrics
Some common pitfalls for even well-run finance departments include:
- Measuring too many metrics. When everything is important, nothing is. Prioritize.
- Relying on averages. Averages can obscure an underperforming payer, region, or facility.
- Ignoring front-end metrics. Most healthcare organizations are fixated on A/R and denials and ignore registration, eligibility, and authorization, which cause most of the problems.
- Against the wrong benchmark. Hospitals are different from a small specialty practice.
- Measure and do nothing. A dashboard not tied to action items is just reporting.
- Optimizing a metric at the cost of other metrics. Lowering costs to improve collections with fewer follow up staff will help for a month and destroy your net collection rate.
- Waiting too long to check. A monthly review identifies issues that should have been fixed in the first week of the month.
Where an RCM Partner Fits In
This cannot be accomplished by every organization in-house in terms of available time, resources and personnel with specific skill sets. Creating dashboards, resolving denials, tracking underpayments and staying current on payer policies takes up a lot of effort which may require one or more people to dedicate their whole day to.
It is here that a well-experienced partner can make a significant difference. An RCM partner does not just process your claims. They give you transparent reports on these very same KPIs, they spot potential issues and manage outcomes. If you’re considering outsourcing your billing, you need to check the following questions with your potential partners:
- What KPIs do you report on and how frequently?
- What are your clean claims and denial rates?
- How do you perform denial root cause analysis?
- Can you show me your sample dashboard/report?
- How do you track underpayments?
Transparency is the key for us at Stream RCM. At any point in time, you have to know how your revenue is doing and why.
At Stream RCM, we believe transparency is the foundation of a good partnership. You should always know where your revenue stands, why it moved and what’s being done about it.
For the official definitions behind many of these benchmarks, see the HFMA MAP Keys.
Frequently Asked Questions
Which are some of the most important RCM Metrics?
Some of the core KPIs that are tracked by almost all CFOs include Days in A/R, clean claims rate, denial rate, net collection rate, accounts receivable over 90 days, cost to collect, charge lag and patient collection rate.
What are some KPIs in medical billing?
Key Performance Indicators or KPIs are some of the measurable values that indicate how effective your billing process is. The KPIs in medical billing measure the speed at which claims are paid, denied claims and overall collection rate.
What are good Days in A/R benchmark?
Some sources recommend anything between 30 and 40 days as being ideal but this will depend greatly on the specialty. Consistent figures above 50 days are usually an indication of problems to be investigated.
How frequently should RCM KPIs be measured?
Operational KPIs such as claim submission rates, denials and charge lag should be measured weekly while financial KPIs including net collection rate and cost to collect can be measured on a monthly basis.
What is the distinction between clean claims rate and first pass resolution rate?
Clean claims rate refers to claims that are accepted free from error upon submission. First Pass Resolution Rate refers to claims that are paid upon submission. Just because a claim is accepted doesn’t mean it won’t get denied at a later date; therefore, FPRR provides a more comprehensive evaluation.
How do I construct a revenue cycle KPI dashboard?
Begin with the decisions you need to make, select 8-10 KPIs, track progress versus goals, enable payer and provider segmentations, assign owners and schedule review.
Are revenue cycle benchmarks the same for all providers?
No. Revenue cycle benchmarks vary by specialty, practice size, payer mix and geographical location. Use published benchmarking numbers as a guideline, but give the most weight to your trend data.
Final Thoughts
A well-functioning revenue cycle does not happen by chance. It occurs due to constant tracking, fair benchmarking, and the ability to respond appropriately to any findings.
When it comes to taking something away from this guide, here is what you should do. Measure the above-mentioned eight metrics. Categorize them in terms of payers, providers, and locations. Benchmark against the best practices of the industry and your own experience. Always relate improvements to money, since it’s the bottom line that gets the attention of your board.
The organizations that remain financially successful are not necessarily those with many metrics. They are those who understand which metrics are important, measure them on a regular basis and solve problems before they grow too big.