


Why Most Practices Are Flying Blind on Billing Performance
Here is a scenario that plays out in medical offices every single month. The schedule is full. Patients are happy. The providers are working hard. And yet, when the bank statement arrives, the numbers just don’t add up the way everyone expected.
In many cases, the problem is not the volume of patients. It’s what happens after the visit: the coding, the claim, the payer’s response, the follow-up, and the patient statement. That entire process is where money quietly leaks out, and you can’t fix a leak you can’t see.
That’s exactly why medical billing KPIs matter. They turn a messy, invisible process into a handful of numbers you can review and act on. Whether you run a three-provider family practice or a multi-location specialty group, tracking the right medical billing metrics is the difference between guessing and knowing.
In this guide, we’ll walk through the 10 most important medical billing KPIs for 2027. For each one, you’ll get a plain-English definition, the formula, a practical benchmark, and actionable steps to improve it. We’ll also cover how to build a simple tracking routine, set fair performance goals for medical billers, and avoid common mistakes practices make when monitoring billing performance.
Let’s get into it.
What Is KPI in Medical Billing?
If you’ve been wondering what KPI is in medical billing, here’s the short version. KPI stands for Key Performance Indicator. In a billing context, a KPI is a measurable number that tells you how well your revenue cycle is working. Think of it like the dashboard in your car: speed, fuel, engine temperature. You don’t need to understand every part of the engine, but you do need those gauges to know when something’s wrong.
A good KPI in medical billing has three qualities:
- It’s measurable. You can calculate it from data you already have in your practice management system or EHR.
- It’s actionable. When the number moves in the wrong direction, you know roughly where to look.
- It’s comparable. You can track it over time and against recognized benchmarks.
The healthcare industry has actually tried to standardize this. The Healthcare Financial Management Association (HFMA) publishes its MAP Keys, a framework of 29 revenue cycle KPIs grouped into patient access, pre-billing, claims, account resolution, and financial management. You don’t need to track all 29 as a small or mid-sized practice. But the framework is a helpful reference point, and several of the KPIs below (like remittance denial rate and net days in A/R) come straight out of that thinking.
A quick distinction worth making: a metric and a KPI aren’t always the same thing. A metric is any number you can count. A KPI is a metric tied to a goal. Counting how many claims you submitted last week is a metric. Knowing that 96% of them were accepted on the first pass, against a goal of 95%, is a KPI.
How to Track Medical Practice Performance Without Drowning in Data
Before we get to the list, let’s talk about how to track medical practice performance in a way that actually sticks. We’ve seen administrators build gorgeous 40-tab spreadsheets that nobody opens after February. Don’t do that.
Here’s a simpler approach that works for most practices.
Start with 8 to 10 KPIs, not 30. The list below is plenty. You can always add more later.
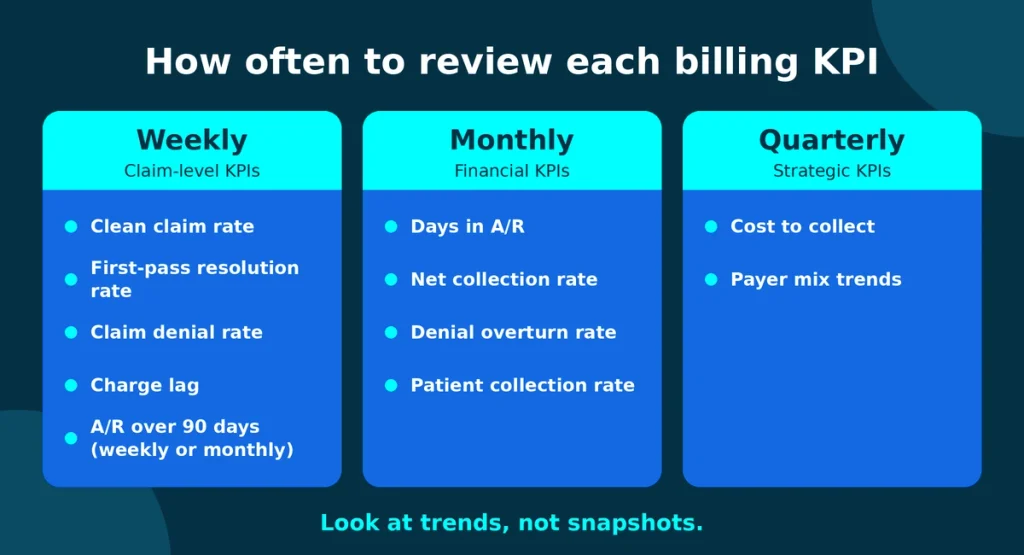
Pick a rhythm. Review claim-level KPIs (clean claim rate, denial rate) weekly. Review financial KPIs (net collection rate, days in A/R) monthly. Review strategic KPIs (cost to collect, payer mix trends) quarterly.
Segment your data. An overall denial rate of 8% might hide the fact that one payer is at 18% and everyone else is at 4%. Always be ready to slice by payer, provider, CPT code, and location.
Assign an owner. Every KPI needs a name next to it. If everyone owns it, no one does.
Write down your targets. Put the goal next to the current number. A number without a target is just trivia.
Look at trends, not snapshots. One bad week isn’t a crisis. Three consecutive weeks of declining clean claim rate is.
A basic dashboard with ten numbers, reviewed on a regular schedule, will beat a complicated system you never look at. Now, on to the KPIs themselves.

The 10 Medical Billing KPIs to Track in 2027
1. Clean Claim Rate
What it is: The percentage of claims that are submitted correctly and pass payer edits without needing any corrections or rework.
Formula: (Number of clean claims ÷ Total claims submitted) × 100
Target: 95% or higher. High-performing billing operations push toward 97 to 98%.
If you only track one KPI, make it this one. Clean claim rate is the earliest warning signal in your entire revenue cycle. A claim that goes out clean gets paid faster, costs less to process, and never enters the denial-and-appeal maze. A claim that goes out dirty can take weeks of back-and-forth, or never get paid at all.
When clean claim rate drops, the usual culprits are boring but fixable: wrong or outdated patient demographics, missing prior authorizations, mismatched diagnosis and procedure codes, and incorrect modifiers.
How to improve it:
- Verify insurance eligibility before the visit, not after. A dedicated insurance eligibility verification process catches inactive coverage and benefit surprises early.
- Use claim scrubbing software that flags errors before submission.
- Make sure your coders are working from complete documentation. Accurate medical coding is the foundation of every clean claim.
- Track which edit errors repeat, and fix the root cause at the front desk or in the chart.
For context, Stream RCM reports a 98% clean claim rate across its client base, which is a good illustration of what a well-run billing process can look like.
2. First-Pass Resolution Rate (First-Pass Acceptance Rate)
What it is: The percentage of claims that are paid correctly on the first submission, with no resubmission, appeal, or manual intervention.
Formula: (Claims paid on first submission ÷ Total claims submitted) × 100
Target: 90% or higher is a strong goal. Best-in-class practices exceed that.
People sometimes confuse this with a clean claim rate, so let’s clear it up. Clean claim rate measures whether your claim was built correctly. First-pass resolution measures whether it was actually paid correctly. A claim can be clean and still get underpaid, pended, or denied for a reason the scrubber couldn’t catch, like a payer-specific coverage rule.
The gap between your clean claim rate and your first-pass resolution rate tells you something useful. A big gap usually points to payer-specific issues, contract problems, or authorization gaps rather than internal data-entry errors.
How to improve it:
- Review your top five payers’ rules at least twice a year. Payers change policies constantly.
- Build payer-specific checklists for high-volume procedures.
- Streamline claim submission so claims go out within a day or two of the visit, not a week later.
3. Claim Denial Rate
What it is: The percentage of submitted claims that payers deny, in whole or in part.
Formula: (Number of denied claims ÷ Total claims submitted) × 100
Target: Under 5% is a widely used goal. Many practices operate between 5 and 10%, which means there’s money on the table.
Denials are the most expensive form of friction in the revenue cycle. Every denial means extra staff time, delayed cash, and a real chance the revenue never comes back. Industry research also consistently shows that a large share of denied claims are never reworked at all, which turns a temporary delay into a permanent loss.
HFMA’s Claim Integrity Task Force has actually done a lot of work on standardizing how denial metrics are defined, including initial denial rate as a percentage of both claim volume and dollars. That’s worth a read, because many practices calculate denial rate differently and then wonder why their numbers don’t match industry reports.
Don’t just track the overall rate. Break it down by:
- Denial reason code (eligibility, authorization, coding, timely filing, medical necessity)
- Payer
- Provider
- Procedure code
Patterns jump out fast. If 40% of your denials trace back to missing authorizations, the fix isn’t in billing at all. It’s about scheduling.
How to improve it:
- Treat every denial as a data point, not just a to-do item.
- Put a structured denial management workflow in place with clear ownership and turnaround times.
- Use prior authorization services for procedures and medications that commonly require approval.
- Hold a monthly 30-minute denial review with front desk, clinical, and billing staff in the same room.
4. Days in Accounts Receivable (Days in A/R)
What it is: The average number of days it takes your practice to collect payment after providing a service.
Formula: Total A/R ÷ (Total charges over a period ÷ Number of days in that period)
Target: Under 40 days is a common goal. The American Academy of Family Physicians suggests staying below 50 days at a minimum, with 30 to 40 days preferable, as summarized by TechTarget’s RevCycleIntelligence.
Days in A/R is the pulse of your cash flow. A rising number means money is taking longer to reach your bank account, which squeezes payroll, supplies, and growth plans. A falling number means your process is getting tighter.
One caution: days in A/R can be misleading if you only look at the average. A handful of very old, very large claims can drag the number up, while thousands of small claims pay on time. That’s why the next KPI matters so much.
How to improve it:
- Submit charges quickly (more on this in KPI 7).
- Work unpaid claims on a schedule, not when someone has time. Consistent A/R follow-up is the single biggest lever for bringing this number down.
- Post payments promptly and accurately. Delays in payment posting make your A/R look worse than it is and hide real underpayments.
5. A/R Aging Over 90 Days
What it is: The percentage of your total outstanding receivables that are more than 90 days old.
Formula: (A/R older than 90 days ÷ Total A/R) × 100
Target: Under 15 to 20% is a typical goal for healthy practices.
The older a claim gets, the less likely you are to collect it. A claim that’s 30 days old is a normal part of doing business. A claim that’s 120 days old is a warning. At that point you’re up against timely filing limits, payer appeal deadlines, and staff who’ve forgotten the context.
This KPI is also where you spot the “ignored pile”: the stack of small-balance or complicated claims that nobody wants to touch. Left alone, that pile grows quietly.
How to improve it:
- Review aging buckets (0 to 30, 31 to 60, 61 to 90, 91 to 120, 120+) every week.
- Prioritize by dollar value and by appeal deadline, not by the order claims landed.
- Set a hard internal rule: nothing sits in the 60-day bucket without a documented next action.
- If your team is stretched thin, outsourcing follow-up on aged claims often pays for itself within a few months.
6. Net Collection Rate
What it is: The percentage of the money you were entitled to collect (after contractual adjustments) that you actually collected.
Formula: (Payments collected ÷ (Charges − Contractual adjustments)) × 100
Target: 95% or higher. Top performers reach 97 to 99%.
Net collection rate is arguably the truest measure of billing effectiveness. It strips away the noise of contractual write-downs (the amounts you agreed to accept from payers) and asks a simple question: of the money that was actually owed to us, how much did we get?
Don’t confuse it with gross collection rate, which compares payments to your full billed charges. Gross collection rate will always look low because it includes amounts you never expected to collect. Net collection rate is the one to put on your dashboard.
If this number slips, look for underpayments, unworked denials, write-offs that were applied too quickly, and weak patient collections.
How to improve it:
- Compare every payment against your contracted fee schedule. Underpayments are common and often go unnoticed.
- Limit who can approve write-offs, and require a reason code.
- Run periodic medical billing audits to find recurring leakage you can’t see day to day.
7. Charge Lag (Days from Service to Charge Entry)
What it is: The average number of days between the date of service and the date the charge is entered and ready for billing.
Formula: Sum of (charge entry date − date of service) for all encounters ÷ Number of encounters
Target: Ideally 1 to 3 days. Many practices aim to keep it under 5.
Charge lag is the silent cash flow killer. It doesn’t show up as a denial or an unpaid claim. It shows up as claims that simply haven’t gone out yet. Every extra day of delay is a day your revenue sits in limbo, and it increases the chance of missing timely filing deadlines.
Common causes include late provider documentation, unsigned notes, missing superbills, and coders waiting on clarification. The fix is often cultural rather than technical: getting providers to close their charts the same day.
How to improve it:
- Set a same-day or 24-hour documentation expectation for providers and track it by provider.
- Use automated alerts for open encounters older than 48 hours.
- Share the data openly. Providers usually want to help once they see how much delay affects the practice’s cash flow.
8. Denial Overturn Rate (Appeal Success Rate)
What it is: The percentage of denied claims that you successfully recover through correction, resubmission, or appeal.
Formula: (Denied claims eventually paid ÷ Total denied claims) × 100
Target: 60 to 70% or higher, depending on your payer mix and denial types.
Tracking denial rate tells you how many claims are being denied. Tracking denial overturn rate tells you how good you are at getting that money back. They work as a pair.
If your overturn rate is low, one of three things is usually happening. Either your team isn’t appealing enough denials, your appeals are weak (missing documentation or clinical rationale), or you’re appealing too late. Remember that every payer has its own appeal window, and missing it means the claim is gone for good.
It’s also worth tracking the time from initial denial to appeal submission. HFMA’s Claim Integrity Task Force specifically recommends this as a denial metric, and for good reason: speed matters.
How to improve it:
- Build template appeal letters for your top 10 denial reasons, then customize each one.
- Set a rule that every denial is reviewed within 48 hours.
- Track appeal outcomes by payer so you know where to push harder.
9. Cost to Collect
What it is: The total cost of running your billing and collections operation as a percentage of the revenue you collect.
Formula: (Total billing costs ÷ Total collections) × 100
Target: Many practices land between 4 and 8%, though it varies widely by specialty and size. The goal is to keep it stable or falling as you grow.
This is the KPI most administrators forget, and it’s where the strategic decisions get made. Your total billing cost includes salaries and benefits for billing staff, software licenses, clearinghouse fees, training, rework time, and any outsourced services.
If you’re running billing in-house, add up the full cost, not just salaries. Include the hidden costs: the hours spent chasing denials, the turnover when a biller leaves and you retrain someone, and the revenue you lose while a position sits empty.
Cost to collect is also the number to look at when you’re comparing in-house billing to an outsourced partner. A good outsourced model with transparent pricing (Stream RCM, for example, advertises service fees starting as low as 2.99% of monthly collections) can bring your cost to collect down while improving the other KPIs on this list. If you want to see what that could look like for your practice, you can explore outsourced medical billing services or look at options built for a small practice.
How to improve it:
- Automate repetitive tasks like eligibility checks, claim scrubbing, and payment posting.
- Reduce rework by fixing upstream errors.
- Measure cost to collect by function (front desk, coding, A/R) to see where effort is concentrated.
10. Patient Collection Rate
What it is: The percentage of patient-responsibility balances (copays, deductibles, coinsurance) that you actually collect.
Formula: (Patient payments collected ÷ Total patient responsibility billed) × 100
Target: 70 to 90% depending on the practice type, with higher rates when collection happens at the point of service.
High-deductible health plans have changed the game. Patients now carry a much larger share of the bill than they did a decade ago, which means a growing slice of your revenue depends on collecting directly from individuals, not insurers. Chasing a $180 balance three months after the visit is expensive, awkward, and far less successful than collecting it at check-in.
This KPI tells you whether your front-end and statement processes are keeping up with that shift.
How to improve it:
- Estimate patient responsibility before the visit and communicate it clearly.
- Collect copays and known balances at check-in, every time.
- Offer easy payment options: online portals, text-to-pay, card on file, and payment plans.
- Send clear, friendly statements. Confusing statements are one of the biggest reasons patients don’t pay.
Quick-Reference Table: Medical Billing KPI Benchmarks

| KPI | Common Target | Review Frequency |
| Clean Claim Rate | 95%+ | Weekly |
| First-Pass Resolution Rate | 90%+ | Weekly |
| Claim Denial Rate | Under 5% | Weekly |
| Days in A/R | Under 40 days | Monthly |
| A/R Over 90 Days | Under 15 to 20% | Weekly or Monthly |
| Net Collection Rate | 95%+ | Monthly |
| Charge Lag | 1 to 3 days | Weekly |
| Denial Overturn Rate | 60 to 70%+ | Monthly |
| Cost to Collect | 4 to 8% (varies) | Quarterly |
| Patient Collection Rate | 70 to 90% | Monthly |
A note on benchmarks: treat these as starting points, not commandments. Your specialty, payer mix, and patient population all affect what “good” looks like. A pain management practice dealing with heavy prior authorization requirements will see different numbers than a family practice. If you want specialty-specific context, Stream RCM covers 50 medical billing specialties.
Setting Performance Goals for Medical Billers
Once you know your KPIs, the next question is how to turn them into fair, motivating performance goals for medical billers. This is where a lot of well-meaning practices go wrong. They hand a biller a target like “reduce denials by 50%” without giving them the tools, authority, or data to make that happen.
Here’s a better framework.
Tie goals to what billers can actually control. A biller can influence how quickly they work denials, how accurate their claim entry is, and how consistently they follow up. They can’t control a payer’s policy change or a provider’s late documentation. Build goals around the controllable parts.
Use SMART goals. Specific, Measurable, Achievable, Relevant, Time-bound. For example: “Work 100% of denials within 5 business days and achieve a 65% overturn rate by the end of Q2.”
Set a mix of quality and productivity targets. If you only measure how many claims someone processes, quality will drop. If you only measure accuracy, speed will crater. Balance both. Good examples include claims processed per day, error rate on audit, days to first follow-up, and appeal success rate.
Start from a baseline. Measure the last 90 days before setting any target. Aim for steady, realistic improvement, such as a 10 to 15% gain per quarter, rather than a dramatic leap.
Review them regularly. Monthly one-on-ones are ideal. Look at the numbers together, talk about obstacles, and adjust goals when something outside the biller’s control changes.
Celebrate progress. Billing is detail-heavy, often thankless work. Recognizing a biller who cut aged A/R by 20% goes a long way toward retention, and turnover in billing departments is expensive.
Understanding Billing Statistics: What the Numbers Tell You
People often search for billing statistics to see how they compare to everyone else. That’s a reasonable instinct, but use industry statistics carefully.
Published averages blend together practices of wildly different sizes, specialties, and payer mixes. A national average denial rate tells you very little if your practice is a behavioral health group with unique authorization requirements. And as HFMA’s own denial task force has pointed out, different organizations define “denial rate” differently, which makes direct comparisons shaky.
A better approach:
- Benchmark against yourself first. Your own 12-month trend is the most reliable comparison you have.
- Then benchmark against peers. Look for data from your specialty association, such as the AAFP for family medicine or MGMA for broader practice management.
- Use industry frameworks for definitions. The HFMA MAP Keys give you consistent formulas so you’re measuring apples to apples.
The goal isn’t to hit a number someone else published. It’s to improve steadily, month after month, against your own baseline.
6 Common Mistakes Practices Make When Tracking Billing KPIs
We’ve worked with enough practice to see the same missteps repeat. Watch out for these.
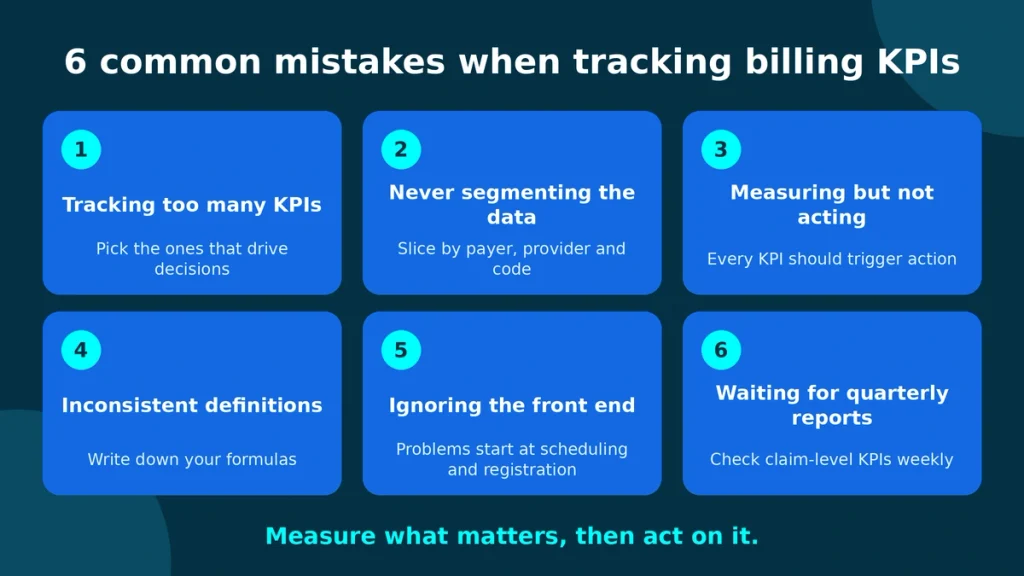
1. Tracking too many KPIs. More numbers don’t mean more insight. Pick the ones that drive decisions.
2. Never segmenting the data. Averages hide problems. Slice by payer, provider, and code.
3. Measuring but not acting. A KPI that never triggers a conversation or a change is just decoration.
4. Inconsistent definitions. If your clean claim rate is calculated one way in January and another in June, the trend is meaningless. Write down your formulas.
5. Ignoring the front end. Many billing problems start at scheduling and registration. If your KPIs only cover the back office, you’ll keep fixing symptoms.
6. Waiting for quarterly reports. By the time a quarterly report reveals a problem, you’ve already lost three months of revenue. Weekly check-ins on claim-level KPIs catch issues early.
When to Consider Outsourcing Your Billing
Tracking KPIs well takes time, tools, and consistent attention. For a lot of practices, especially smaller ones, that’s a stretch. Your front desk staff is already juggling phones, check-ins, and insurance questions. Your lead biller may be a team of one.
Signs it might be time to bring in outside help:
- Your days in A/R keep creeping above 45 or 50.
- Your denial rate has been stuck above 8 to 10% for several months.
- You don’t have anyone who regularly reviews KPI reports.
- You’ve had billing staff turnover and the work has piled up.
- You’re expanding, adding providers, locations, or specialties.
- You suspect you’re leaving money on the table but can’t pinpoint where.
A full-service partner handles the whole cycle: eligibility checks, coding, claim submission, payment posting, denial management, and A/R follow-up, along with the reporting that lets you see your KPIs in real time. Stream RCM’s team works with practices across more than 50 specialties and offers a free billing audit, which is a no-pressure way to find out where your current process stands. You can request a free demo or audit here.
If you’re an independent physician group, our physician billing services are designed around exactly these KPIs.

Frequently Asked Questions
What is KPI in medical billing?
A KPI (Key Performance Indicator) in medical billing is a measurable value that shows how effectively your practice is billing, collecting, and managing revenue. Common examples include clean claim rate, denial rate, days in A/R, and net collection rate.
What are the most important medical billing KPIs?
If you’re just starting out, focus on clean claim rate, claim denial rate, days in A/R, and net collection rate. Those four give you a strong picture of both claim quality and cash flow. Add the others as your tracking matures.
How often should I review medical billing metrics?
Review claim-level metrics like clean claim rate and denial rate weekly. Review financial metrics like net collection rate and days in A/R monthly. Strategic metrics like cost to collect can be reviewed quarterly.
What is a good clean claim rate?
Most practices aim for 95% or higher. High-performing operations reach 97 to 98%. If you’re below 90%, there’s likely a recurring front-end or coding issue worth investigating.
What are good days in A/R number?
Under 40 days is a widely used goal. The AAFP recommends staying below 50 at a minimum, with 30 to 40 days preferable. Specialty and payer mix can shift what’s realistic for your practice.
How do I lower my claim denial rate?
Start by identifying the top reasons for denials, then fix the upstream cause. Verify eligibility before visits, obtain authorizations in advance, scrub claims before submission, and train staff on payer-specific rules. A formal denial management process helps you recover revenue and prevent repeat issues.
Can a small practice track these KPIs without a big budget?
Absolutely. Most practice management systems and EHRs include basic reporting, and a simple spreadsheet works fine to start. The key is consistency. If tracking feels overwhelming, outsourcing partners can provide the reporting for you.
Should I benchmark my practice against industry averages?
Use them as a loose guide, but prioritize comparing your own results over time. Industry averages blend together practices with very different circumstances, so your own trend line is usually more meaningful.
Final Thoughts: Measure What Matters, Then Act on It
Tracking medical billing KPIs isn’t about creating more reports. It’s about gaining control over the part of your practice that keeps the lights on.
Start small. Pick your top five KPIs this month, write down your current numbers and your targets, and assign an owner to each one. Review them on a fixed schedule. When a number moves the wrong way, dig into the cause rather than just reporting it upward.
Do that consistently through 2027, and you’ll catch revenue leaks earlier, collect faster, reduce staff stress, and give your providers more time to focus on patients instead of paperwork.